
Loyalty Metrics: Use the Right Method
The Goal: What Drives Loyalty
One important goal we have is marketing research is working out what product/service perceptions, or drivers, will lead customers to purchase a product and/or become repeat/loyal customers.
The Challenges Of Identifying Drivers
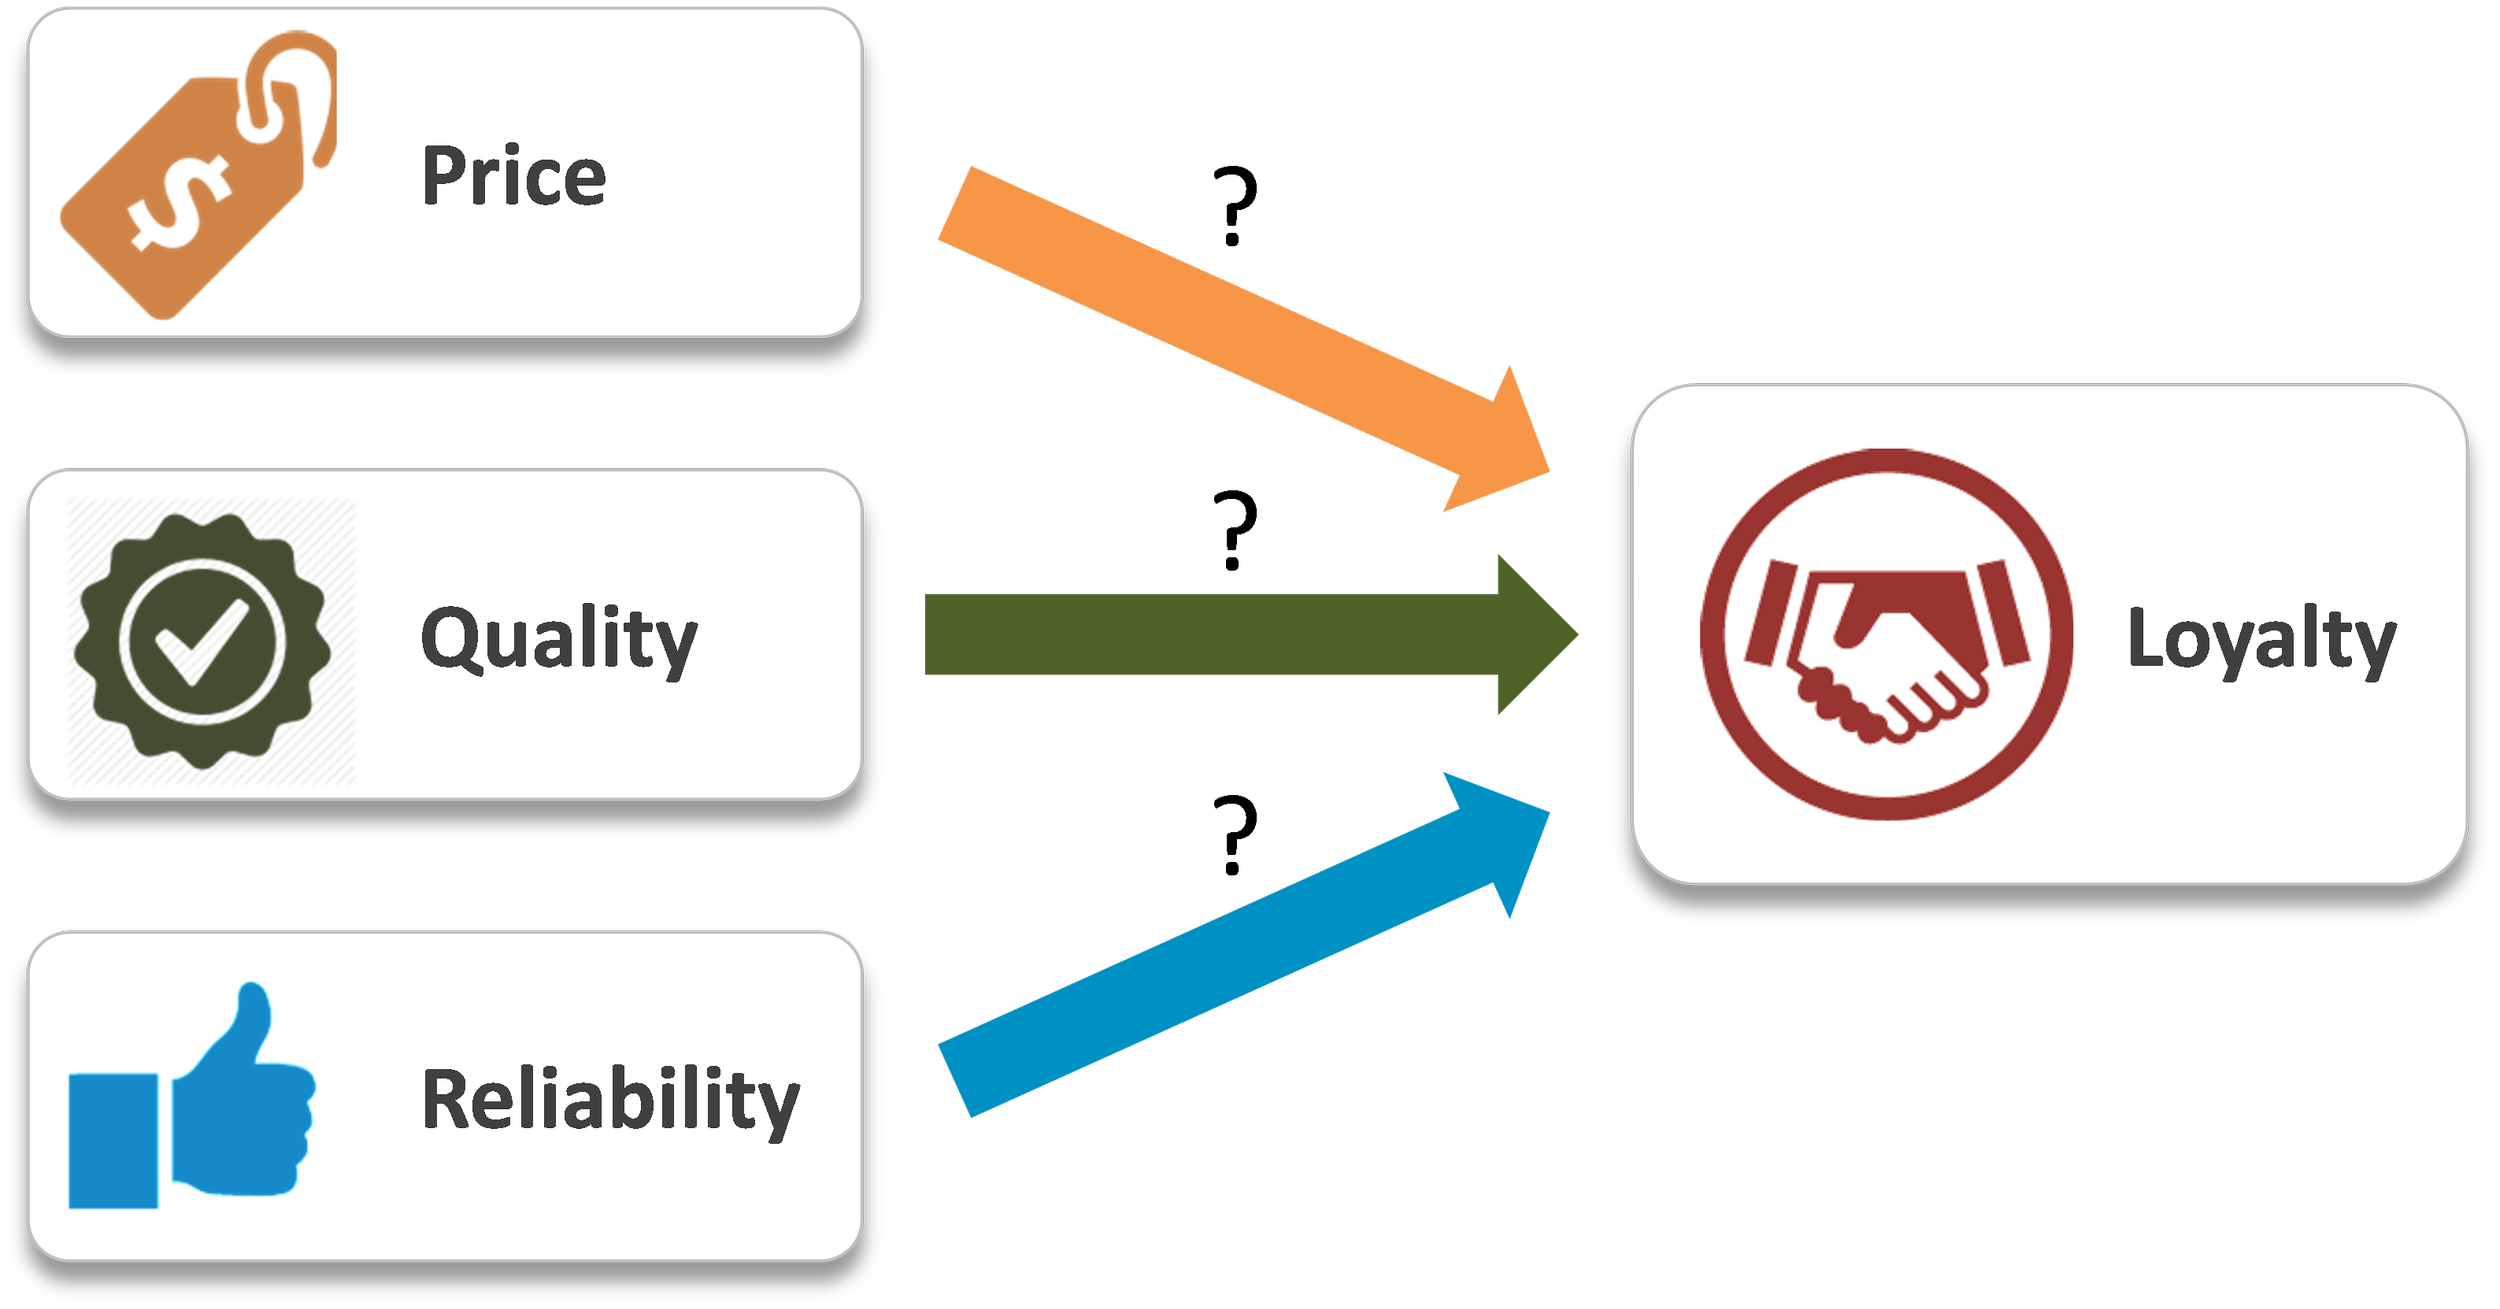
We would like to identify the drivers that are the most important influences on customer loyalty, but this task can be difficult when multiple drivers are related to one another. Suppose you were trying to predict customers’ loyalty for a particular brand of laptop computer based on customer perceptions of price, quality, and the reliability of the manufacturer. These three drivers of purchasing intentions are correlated with each other. Customers who say the product is fairly priced also tend to say that the manufacturer is high quality and reliable. Which drivers matter the most?
Problematic Methods
Correlations
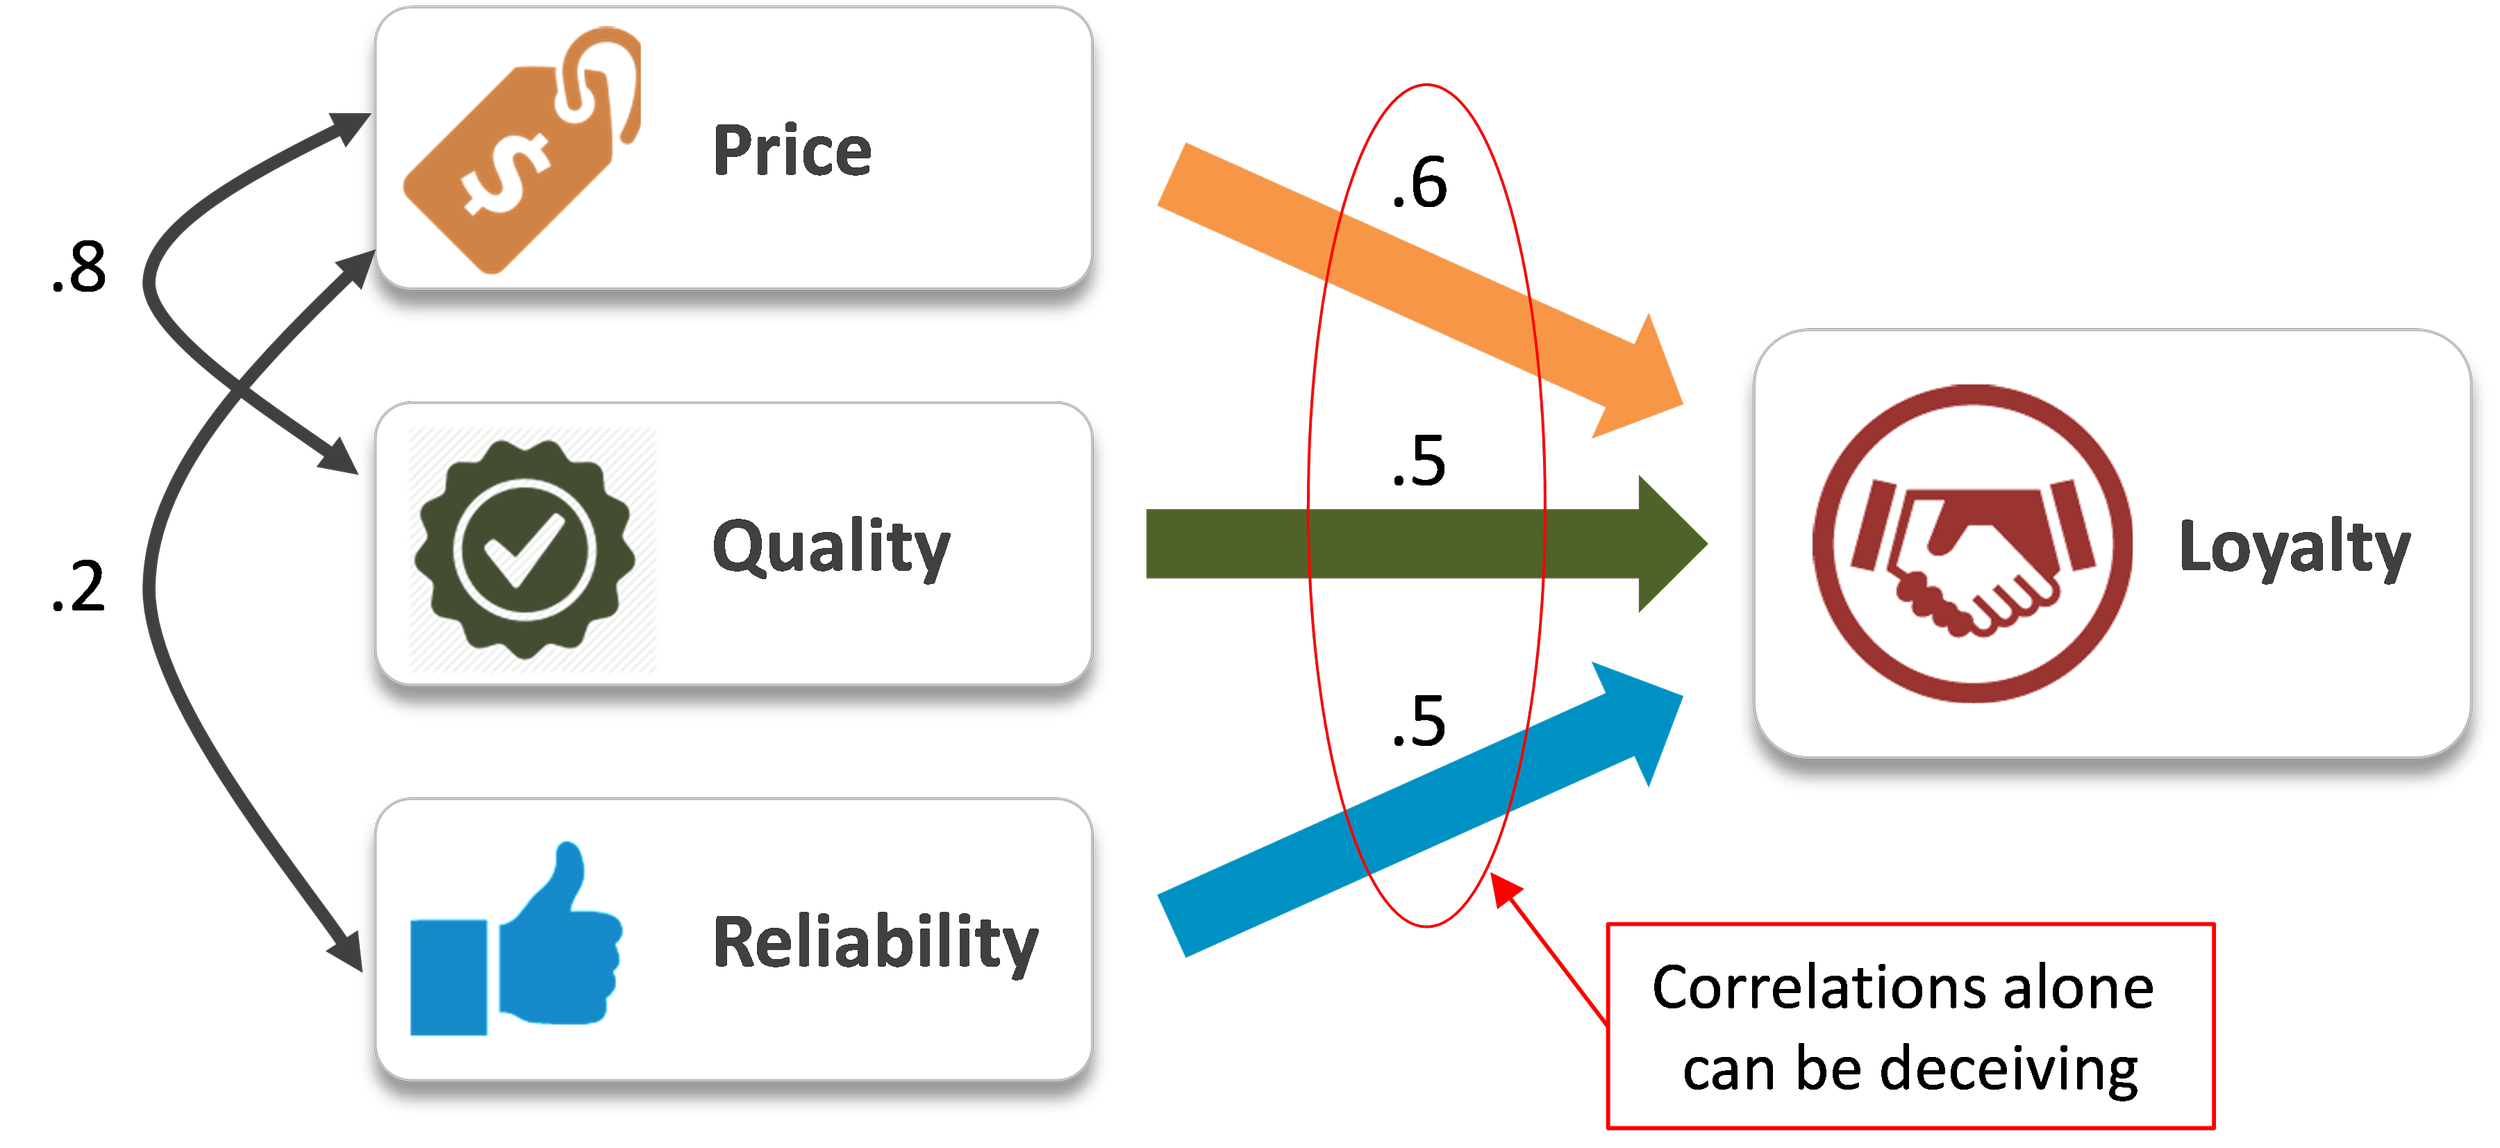
One standard approach to this question looks at the correlation between each driver and customer loyalty. According to this approach, the driver with the largest correlation is the most important, the driver with the next largest correlation is the second most important, and so forth. This approach sounds simple enough, but it can lead to inaccurate conclusions. Suppose that customer loyalty has a correlation of .6 with price, and .5 with quality and reliability. It might appear that price was the most important driver, and that quality and reliability were equally important. However, remember that drivers are usually correlated with each other. Suppose that quality has a correlation of .8 with price, while reliability has a correlation of .2 with price. This means that once you have used price to explain customer loyalty, information about quality will not add much to the predicting loyalty because ratings of quality are redundant with price. However, after you have used price to explain loyalty, information about reliability will add to the prediction of loyalty because ratings of reliability and price do not overlap very much. To estimate the importance of multiple correlated drivers, what is needed is an approach that examines the unique contribution of each driver, such as multiple regression.
Stepwise Multiple Regression
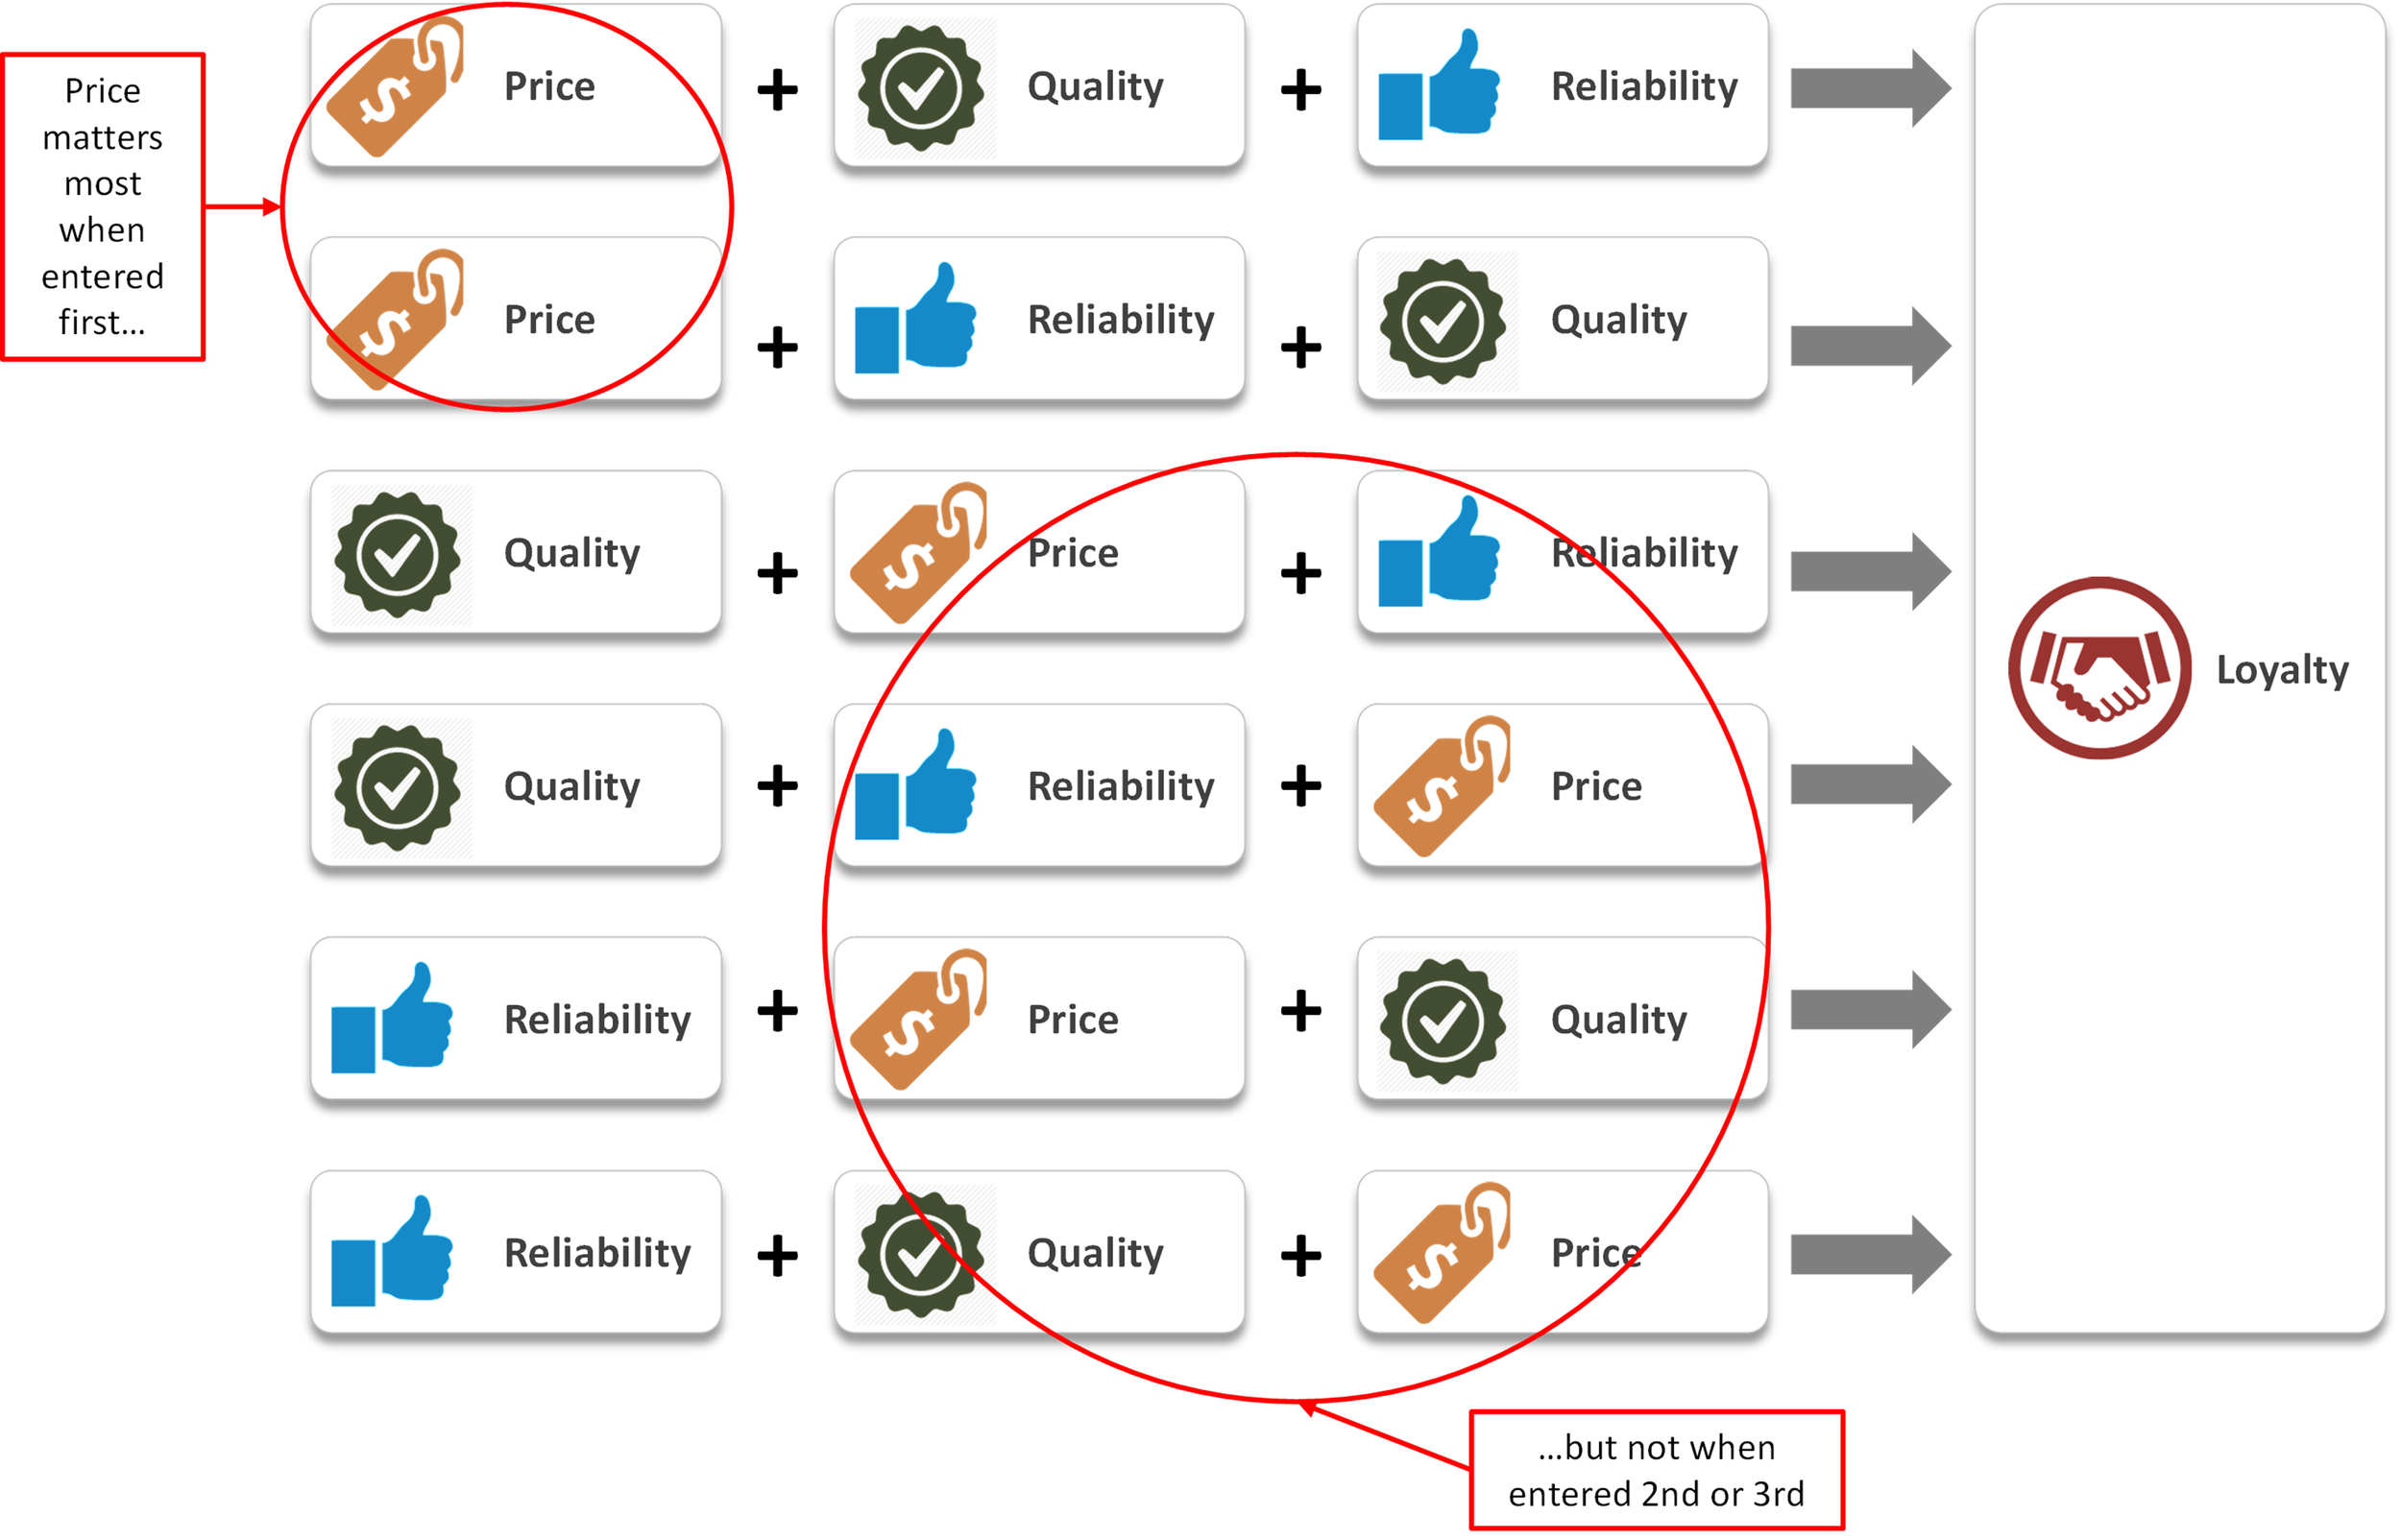
Another standard approach to this question is to carry out a stepwise multiple regression analysis. This analysis builds a prediction formula by adding the drivers in a single fixed order, starting with the driver that has the strongest association with the outcome. In our example, the driver with the strongest association with loyalty would be entered first, even if the difference between the strongest and the next strongest association was very small. Suppose we enter price into the equation first because it has a correlation of .6 with loyalty, while quality and reliability each had a correlation of .5 with loyalty. Then we go on to the next stage of building the regression model and we find that when you know price you can still improve your prediction of purchasing by adding quality and reliability to the equation. Following the standard stepwise procedure, we would conclude that price is the most important driver, and that quality and reliability have minor importance.
This conclusion might be completely wrong because we only considered one order of the drivers: price first, followed by quality and reliability.

A Better Method
Averaging Over Orderings Regression
Suppose we did not stop with the standard approach and decided to build the regression model in a different order? What if we found that when quality and reliability are in the equation, adding price does not improve your ability to predict purchasing intentions? This scenario can happen when drivers are correlated with one another (as they usually are). If we put together the results of our original analysis and the new analysis, we would have good reason to think that quality and reliability are more important than price. Price predicts purchasing only when it is first in order, but quality and reliability always contribute to the prediction of purchasing,
To draw accurate conclusions about the importance of drivers, it is essential to rigorously and systematically consider all possible orders of drivers, and to find out the average importance that a driver has across all of the possible orders. This comprehensive approach to the analysis of drivers is known as the Averaging Over Orderings (AOO) method.
The benefits of the AOO method include:
AOO considers all orders of entry into the regression equation, thus better managing the common issue of overlap between drivers.
AOO assigns a single number representing the importance of a driver that summarizes the results of scores of regression analyses.
AOO demonstrates how a driver like price actually affects customer loyalty. Rather than asking customers how important they think price is to their feelings of loyalty, AOO derives importance by looking at the relationship between satisfaction with a driver and overall satisfaction or loyalty. AOO results are more accurate than customers’ reports of importance because AOO is based on a systematic and thorough analysis of the conditions that actually foster loyalty.
Because you do not need to ask customers about the importance of specific drivers, you can save space on your survey.
Contact Us For More Information
If you have any questions and would like to discuss the application of these methods to your individual situation, you can reach us at contactus@elucidatenow.com.