
SOLUTIONS
We collect and analyze fact-based information to improve your products and services, and to help you better understand and reach your customers and prospects.
Our business solutions ensure you:
Have the best possible feature set
Reach the right prospects for your product
Understand the opportunity for a new service
Maximize the price you can charge
Improve customer satisfaction and loyalty and improve revenue
Message effectively
Validate your internal opinions
Discover the must-haves vs the nice-to-haves
Segment your market based on both attitudes/behaviors and targeting variables
PRODUCT DEVELOPMENT
Creating the best possible products or services drives company success. Whether you are at the beginning stages of concept design or you are trying to extend the life of an existing offering, product development research can help your business win in the market. Where Research Helps:
Determine the best price for your product or service
Learn which features are most important to include in your product, and which you should develop first
Understand the incremental value of product feature changes
Quantify the price premium associated with your brand
Gauge demand change of price changes
Learn how your product with compete in the current (and future) competitive landscape
Measure cannibalization of share from existing products/ see how you could steal share from competitors
Determine the price/feature combinations that lead to the ideal product mix
Conduct strategic pricing – test novel price ranges for current or new products
Understand which features or offerings should be bundled together to reach the greatest number of people
Measure preference for bundled versus a la carte purchases
Below are some tools/methods elucidate uses in product development research.
CONJOINT ANALYSIS
We have conducted dozen of conjoint projects, from straightforward product optimization to complex product line-up configuration and pricing. Conjoint is a great tool that forces respondents to make difficult trade-offs, just like real-world buyers have to do. When we force them to make these trade-offs, we get a much better picture of the values of the product attributes; we get better discrimination.

We are particularly skilled in complex applications of conjoint, including highly customized versions of Adaptive Choice-Based Conjoint.
What-If Simulator (A Component Of Conjoint Projects)
A market simulator allows visibility into future product/feature/price preferences even when the market changes in the near term. Testing “what if” scenarios can guide many aspects of product development and positioning. A simulator provides a number of advantages: Lengthens the shelf life of the data Many research projects end with answering the primary research question. A simulator, when done correctly, allows for clients to go back to the research and ask “what if” questions that may not have even occurred to them during the study. This is especially useful in product development when a project is designed to see product preferences in the context of competition. When the market changes- the simulator can be used to see impacts Shifts within a given market occur all the time; a simulator can be used to see potential impacts. One example is price decreases. With a competitive market simulator, prices can simply be adjusted down (even for competitive products) and share of preference can be re-measured. Elucidate has developed a proprietary simulator that clients rave about. One client said “In my role in product development, I have used dozens of conjoint simulators, this is the best one I have ever used.” Features and advantages of the elucidate market simulator include:
Filter / Banner capability: Can use simulator on entire dataset or sub-cuts of data
Multiple product client share of preference: Can see preference scores for a single product or multiple products stacked on top of each other
Competitor share of preference: Can see competitor share of preference
Price elasticity calculator: Can see how a range of price points impacts share of preference
Multi-view Results: can see summarized or detailed results with one click
Other advantages include:
Very user-friendly: Takes less than 15 minutes to understand all features
No Licensing: The product is delivered to clients and they can continue to use the simulator an unlimited number of times on as many computers as needed.
MAXDIFF SCALING
MaxDiff (Maximum Difference Scaling) is an approach for obtaining preference/importance scores for multiple items (brand preferences, brand images, product features, messages, advertising claims, etc.). MaxDiff is also known as “best-worst scaling”. Today, beyond standard MaxDiff, there are numerous ways to improve results to better answer business questions. Anchored MaxDiff takes the best of MaxDiff (valid gauging of relative preference or importance) and adds a threshold value above which absolute importance is identified. Sparse MaxDiff and Express MaxDiff allow study of 100 or more items. We are well-versed in all varieties of MaxDiff. MaxDiff scores are easy to interpret. When you see a “10” it has twice as much value as a “5” – something you can’t do with rating scale results.

TURF
Total Unduplicated Reach and Frequency (TURF) examines a variety of possible subsets of items to find the bundle that reaches the most people possible. We commonly use MaxDiff data as the input for TURF, which introduces the ability to conduct simulations similar to conjoint-style market simulations. You select which items are to be made available to respondents (as if they were in competition with one another within a marketplace). The percent of respondents projected to “choose” each item as “best in market” is computed. We are also well-versed in advances in TURF methodology that allow for the examination of very large subsets from very large total sets of items.

CUSTOMER TARGETING
Customer targeting is a core need of all businesses. Whether it is finding new customers or extracting more value from existing customers, a one-size-fits-all approach to marketing is not sufficient.
Where Research Helps:
Identify the prospects most likely to become your customers
Prioritize sales and marketing efforts to focus on the best opportunities
Push the most appropriate and best performing messages to the people for whom they will best resonate
Learn which product or service features will best attract new customers or retain current ones
Identify value propositions most likely to appeal to prospects
Below are some tools/methods elucidate uses in customer targeting research.
MARKET SEGMENTATION
Your market is made up of lots of people – customers, prospects, users – call them what you will. The bottom line is that they’re not all the same. They have different needs, different behaviors, different attitudes, different demographic profiles, etc. If you don’t understand these differences, you are left with a one size fits all approach to marketing to them, which we can all agree wastes time and money and does not yield the results you need. Call it a Market Segmentation, a Customer Segmentation, Segmentation Analysis, or Segmentation Modeling; all these techniques are similar in that they define targetable groups to help you better market your product or service.

Reverse Segmentation is a newer technique that solves many problems associated with traditional attitudinal and demographic segmentations. Reverse segmentation helps identify market segments with highly differentiated attitudes and behaviors, while at the same time considering the demographics/ firmographics, media usage, or channel usage information that is needed to reach people and deliver a targeted message.
CONVERSION SCORE
Understanding both purchase drivers as well as demographic characteristics is important to understanding how to increase sales in targeted groups. Targeting can become even more precise by adding elucidate’s “Conversion Score”. As part of a segmentation analysis, we calculate a composite score that guides clients to where they can get “the most bang for their buck”. The conversion score takes the size of the segment, weights those that are compatible prospects, and includes their likelihood to buy a product. Having this conversion score helps prioritize which group(s) to target first.

BRAND POSITIONING
Understanding perceptions of your company’s brand is essential in today’s competitive market. Tracking how your brand is perceived and the attributes that are associated with it (and its competitors) is critical to maintaining brand strength. Where Research Helps:
Identifying brand awareness and preference
Visualizing brand positioning
Ranking importance of brand attributes in purchase decision-making
Identifying most appealing messages or images
Identifying unique target groups for messaging
Identifying ideal brand and sub-brand names
Calculating the value of the brand name in relation to other attributes (product components, price etc.)
Measuring loyalty drivers in relation to brand image
Below are some tools/methods elucidate uses in brand positioning research:
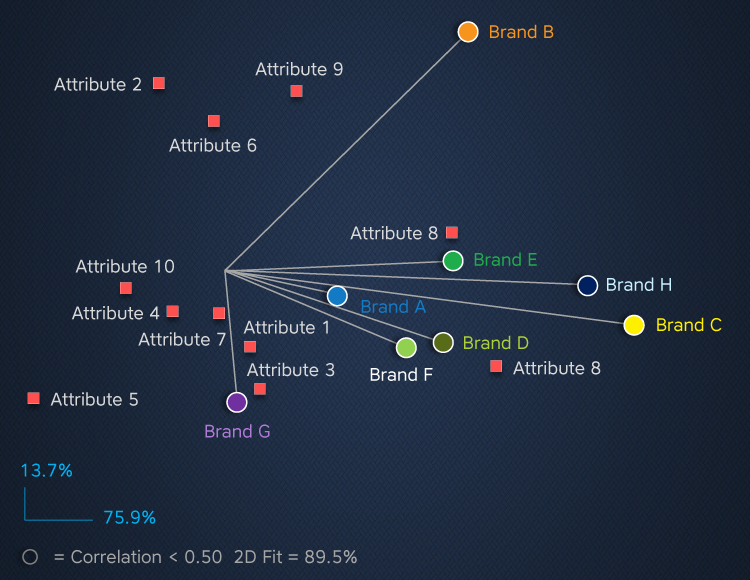
BRAND POSITIONING MAP
BRAND AWARENESS IMPORTANCE
Brand Map technology provides a three dimensional view of relative ranking on attributes for both one’s own company and competitors. Providing relative strengths and weaknesses on associated attributes for all companies can help clients make strategic branding decisions.
Monitoring awareness and leadership on attributes can be very helpful. However, the data can be more meaningful when clients understand how customers rate overall importance of attributes. Anchored MaxDiff is an outstanding methodology for this purpose, where attributes are ranked on a ratio scale. Additionally, a threshold is shown, above which certain attributes reach a level of absolute importance. Clients find that using this data in conjunction with Brand Map / Brand Scorecard results provides them the inputs to make better strategic marketing decisions.

BRAND POSITIONING SCORECARDS
Brand Scorecards place measured attributes in a dashboard view that includes all competitive rankings. We statistically evaluate relative rankings and color code performances so our clients can easily see their own performance against competitors. This view can be especially useful when an organization is prioritizing which attributes to use for marketing materials. It is also useful for Brand Trackers where previous scores can easily be seen side-by-side to see relative improvement, or compare different countries on the same attribute.

CUSTOMER SATISFACTION
Understanding if your customers are loyal to your company is critical to maintaining success. While understanding overall satisfaction is necessary, understanding the actual drivers of satisfaction and loyalty is even more important. Where Research Helps:
Identify baseline satisfaction/loyalty within a customer or employee sample
Measure satisfaction/loyalty over time for comparison
Determine key drivers of loyalty, in order to improve specific areas of a business
Gauge satisfaction/loyalty scores within different areas of a business (sales, customer support, etc.)
Identify satisfaction levels with specific transactions in order to follow-up with clients quickly
Determine the likelihood of customer churn prior to actual defection
Below is a breakthrough method elucidate used for measuring Customer Satisfaction:
IDENTIFY CUSTOMER CHURN
Overview: Combines traditional loyalty survey questions, Conjoint Analysis, and Segmentation to better understand churn. Customer loyalty programs are tried-and-true and very important to the inner workings of an organization. However, one component still missing from these programs is the likelihood a customer is swayed to leave by specific competitive offerings. By presenting key competitive products to a current customer base, and asking those customers if various products are attractive enough for them to consider leaving their current provider, an organization can gain a new level of extremely useful information. Elucidate identifies how much of a customer base may be vulnerable to defection, and profiles “vulnerability groups” to help understand what might be driving vulnerability.

Customers are not all the same. They have different needs, different behaviors, different attitudes, different demographic profiles, and different vulnerabilities. If companies don’t understand these differences, they are left with a one size fits all approach to retain them.
